By: Kumar Aryal, Aakriti Dhakal, Reshu Karki, Ashok Ghimire, Sushant Dhital and Susa Manandhar
At 8:37 in the morning on 26 August 2026, a slab of rock and ice roughly 2 km wide tore away from the north face of Langtang Lirung, in Nepal’s Rasuwa district near the border with China (NDRRMA, 2026). It fell more than 1,200 metres down before striking the valley floor, causing flooding downstream of Lhende Khola, the Bhote Koshi, and the Trishuli River system, reaching communities in Rasuwa, Nuwakot, Dhading, Gorkha, and Chitwan districts within a few hours. USGS seismic stations briefly registered the impact as an earthquake-like seismic event, with preliminary magnitude estimates ranging from 4.4 to 5.2.
The mechanical trigger was a sudden and violent structural detachment. But a subtler process had been building toward this moment for decades of warming, quietly reshaping the thermal conditions locked inside the mountain. This is the story of that warming, and how it helped set the stage for one of High Mountain Asia’s most consequential cryospheric disasters in recent memory.
The Morning It Happened
The disaster unfolded in distinct stages, each racing downstream faster than warnings could travel. At 08:37 NPT, the mass of rock and ice was released from an elevation of roughly 5,200 to 5,400 metres, striking the valley floor and transforming into a rapidly moving debris flow. At its fastest peak velocity of around 167 km/h, the initial high-energy front covered approximately 22 kilometres in only about 7 minutes, striking the Rasuwagadhi area on the Nepal-China border with devastating force. This initial shockwave destroyed the customs office, immigration post, Miteri bridge, and infrastructure around Gyirong Port, while destroying the Rasuwagadhi stream gauge before it could transmit an emergency warning.
Following the initial front, the primary, bulked flood wave continued down the river corridor. Moving through Timure (~25 km downstream from the collapse) roughly 16 minutes post-failure, the surge inundated both Timure and nearby Syabrubesi (1,503 m elevation; ~15 km by road downstream from Rasuwagadhi) between 09:10 and 09:25 NPT, aligning with Rasuwa’s Chief District Officer placing local impact at roughly 09:15 NPT.
The flood then continued its long descent toward the plains through progressively lower key settlements: Betrawati (roughly 1,000 m), Trishuli Bazaar (roughly 870 m), and Galchhi (roughly 800 m). By 10:30 NPT, the flood peak passed Betrawati, located 66 kilometres downstream of the collapse site. Between 11:00 and 12:00 NPT, the surge reached deeper into the system, sweeping through a downstream valley corridor extending nearly 100 km toward Galchhi. During this phase, river levels spiked abruptly, rising 9 metres in 30 minutes at Galchhi and 7 metres at Malekhu.
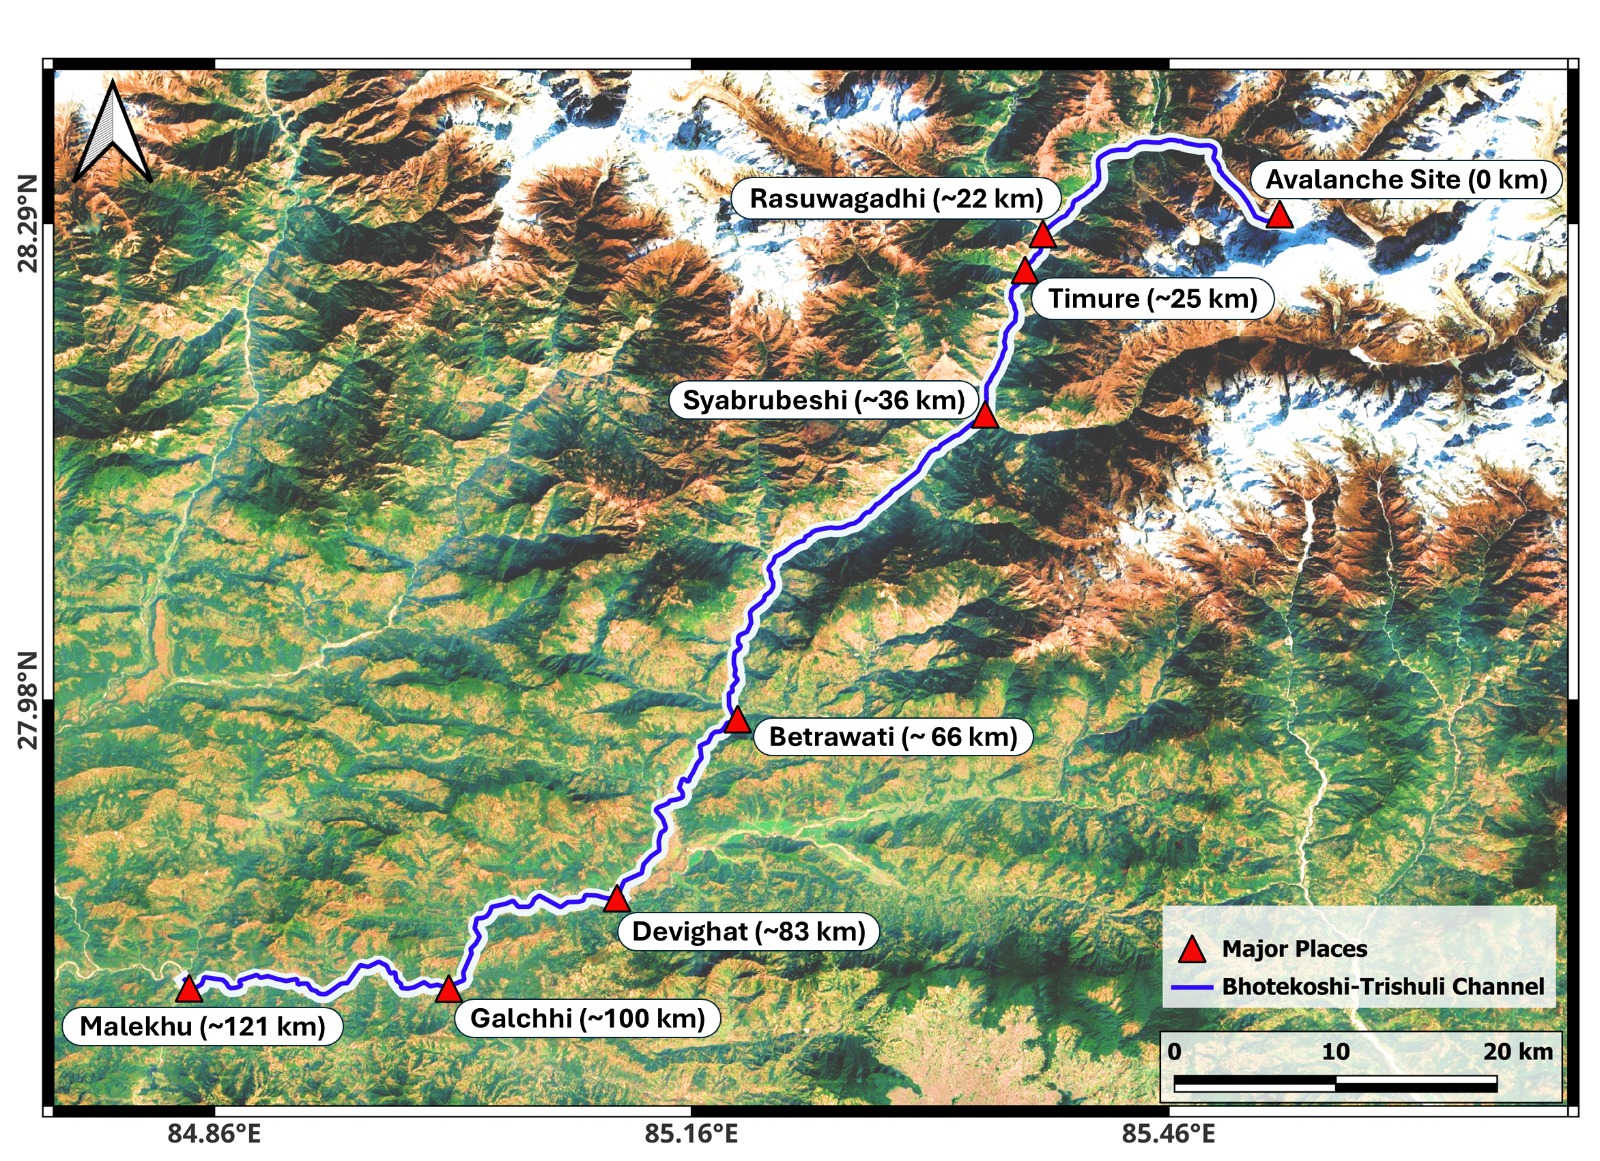
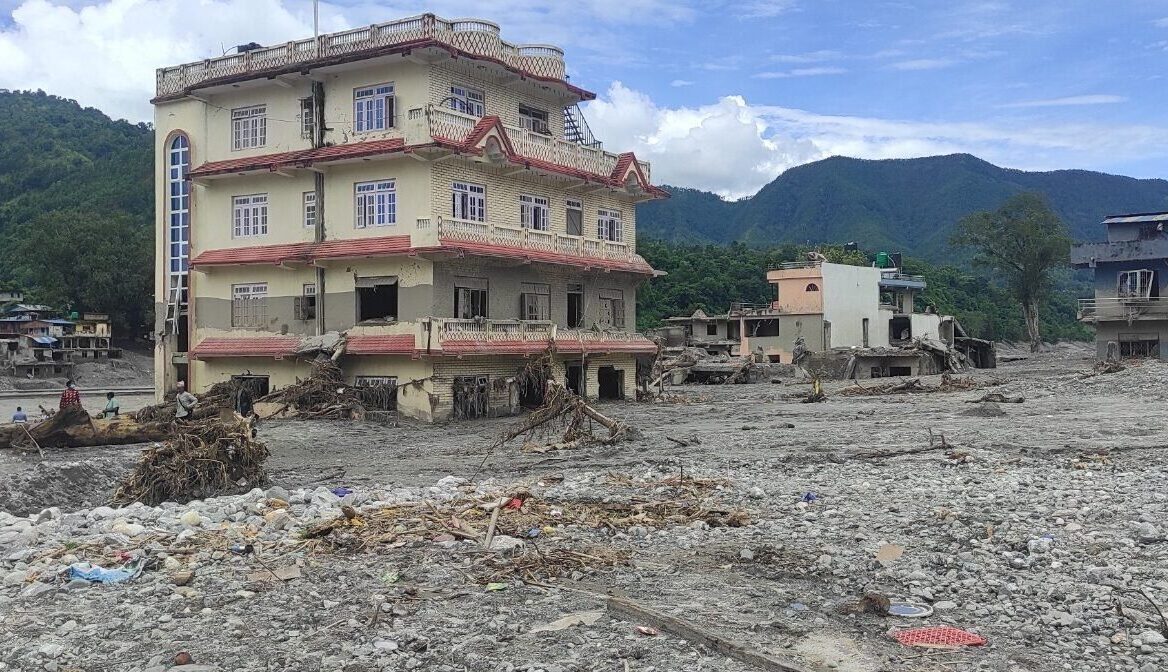
In the process, the flood destroyed four key monitoring stations that might have recorded its magnitude: the Bhote Koshi and Syabrubesi gauges in Rasuwa, the Betrawati gauge in Nuwakot, and the Malekhu gauge in Dhading, leaving a critical data gap in the event’s hydrometric record. The gauge at Galchhi, located more than 80 km downstream and among the most upstream stations to remain operational, recorded a peak water level of 8.5 m (Center for Land Surface Hazards (CLaSH), 2026).
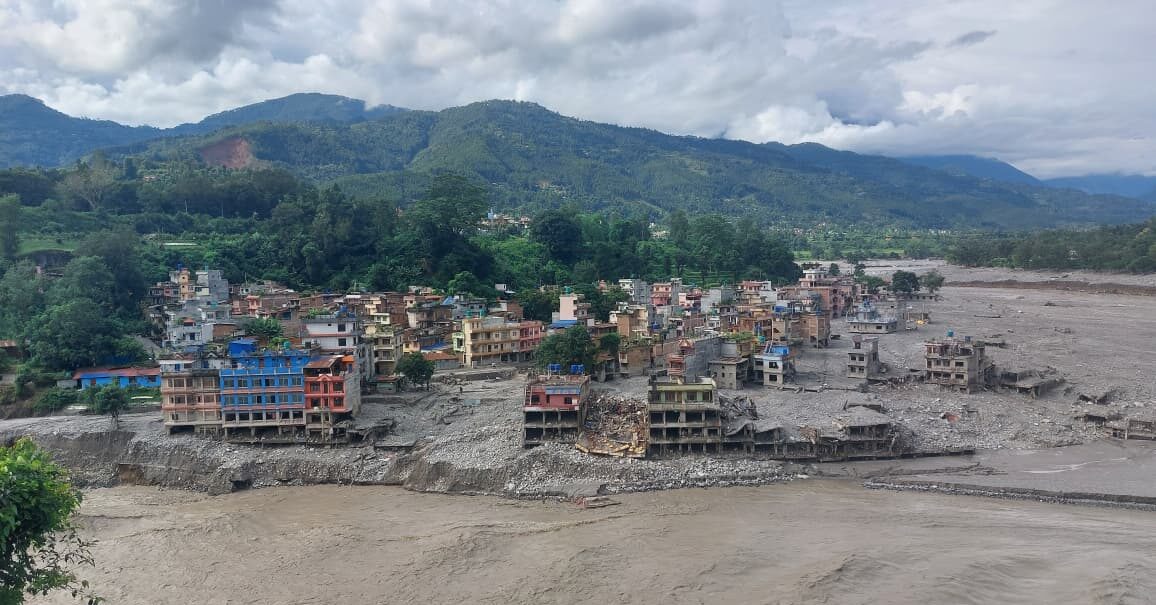
Landscape Transformation: Before and After the Event
Satellite imagery from 24 and 26 August 2026 let us watch this transformation happen in near real time.
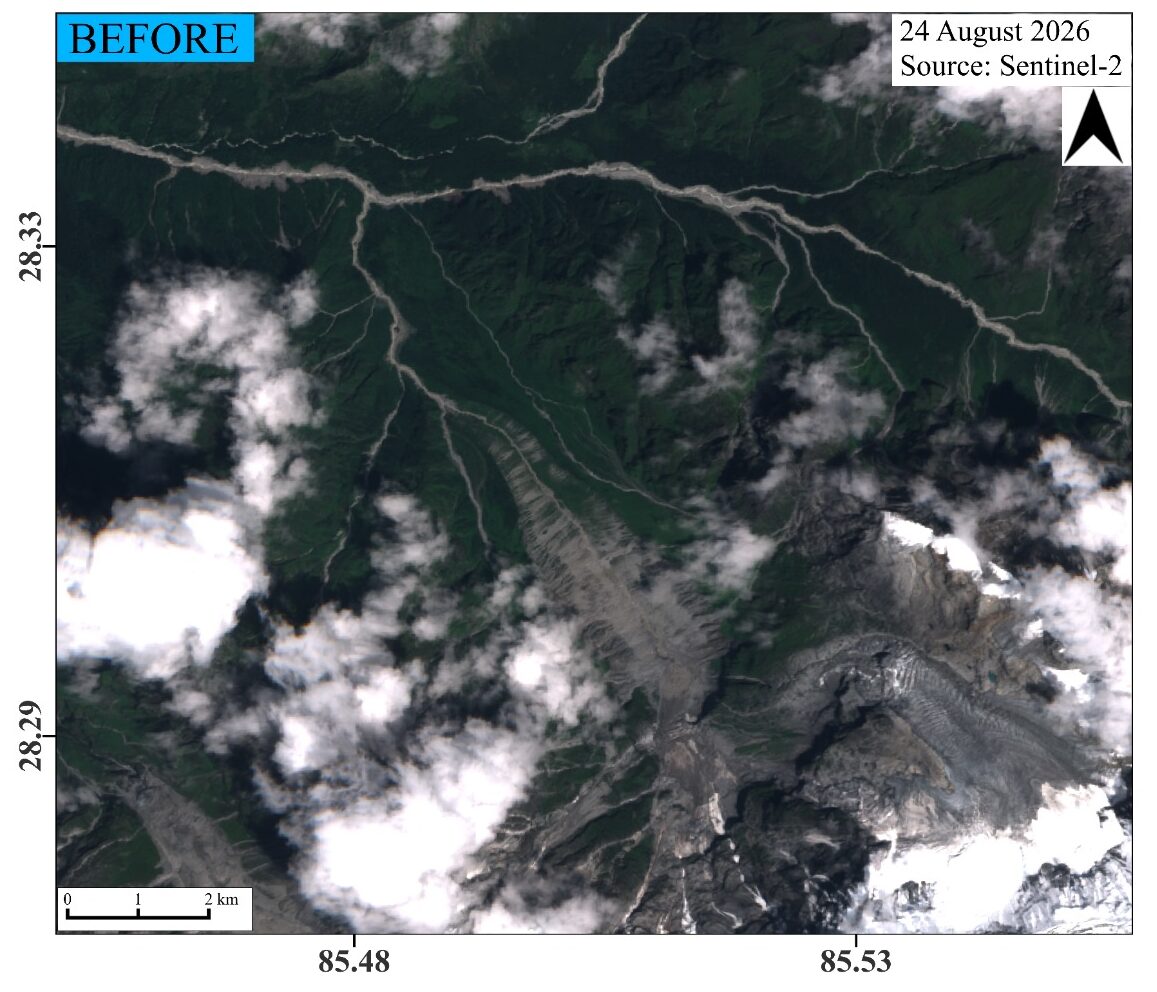
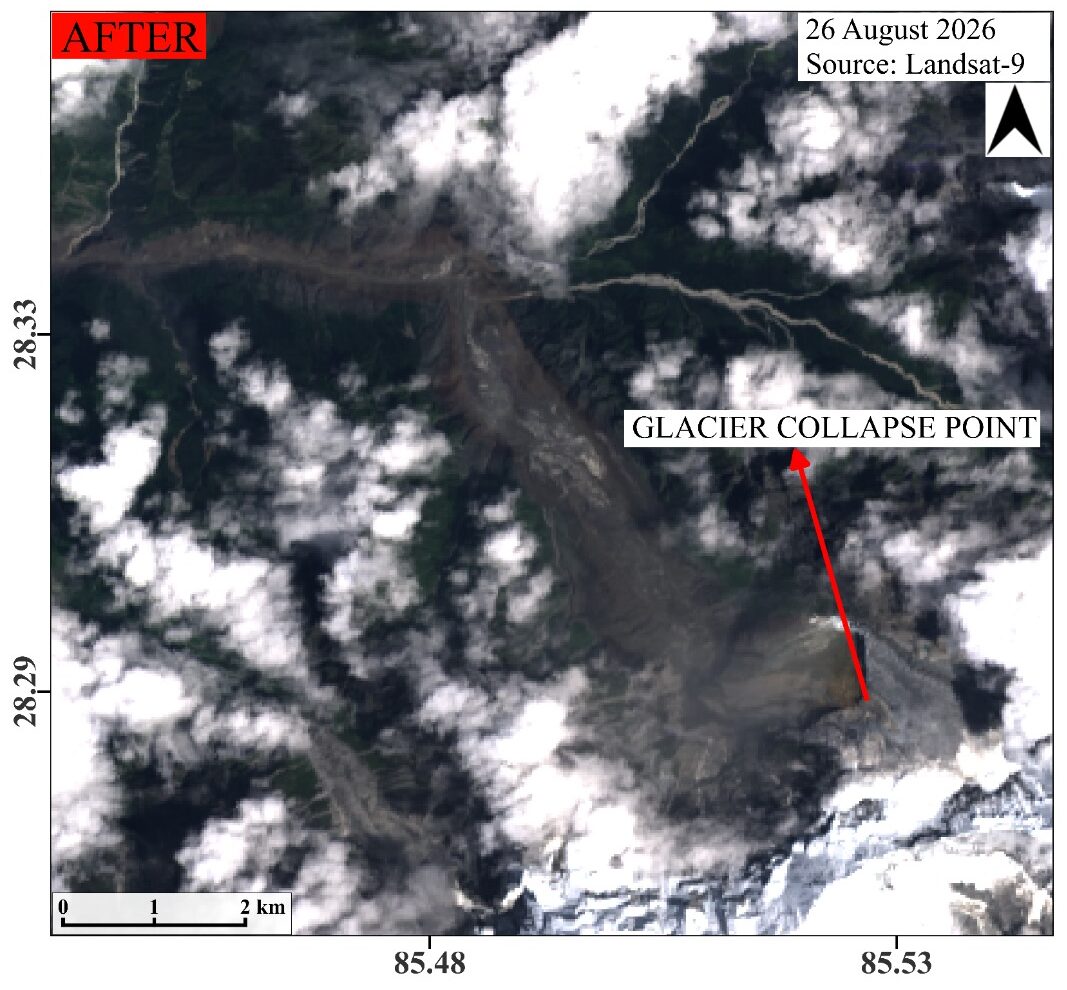
Figure: Sentinel‑2 imagery of the upper Lhende Khola valley acquired on 24 August 2026 (pre‑event) and Landsat‑9 imagery of the same area showing the Langtang‑Lirung avalanche detachment zone following the 26 August 2026 collapse (post‑event)
Two days before the collapse, the valley still carried its ordinary summer character: a braided river channel with several threads of meltwater winding through gravel bars before merging further downstream. A long-established debris fan lay across the valley floor, and the high terrain nearest the peak still showed patches of bare rock and permanent snow.
By 26 August, that entire channel network had been erased, replaced by a single, much wider corridor of scoured earth and freshly deposited sediment, the unmistakable signature of the debris flow that had swept through hours earlier.
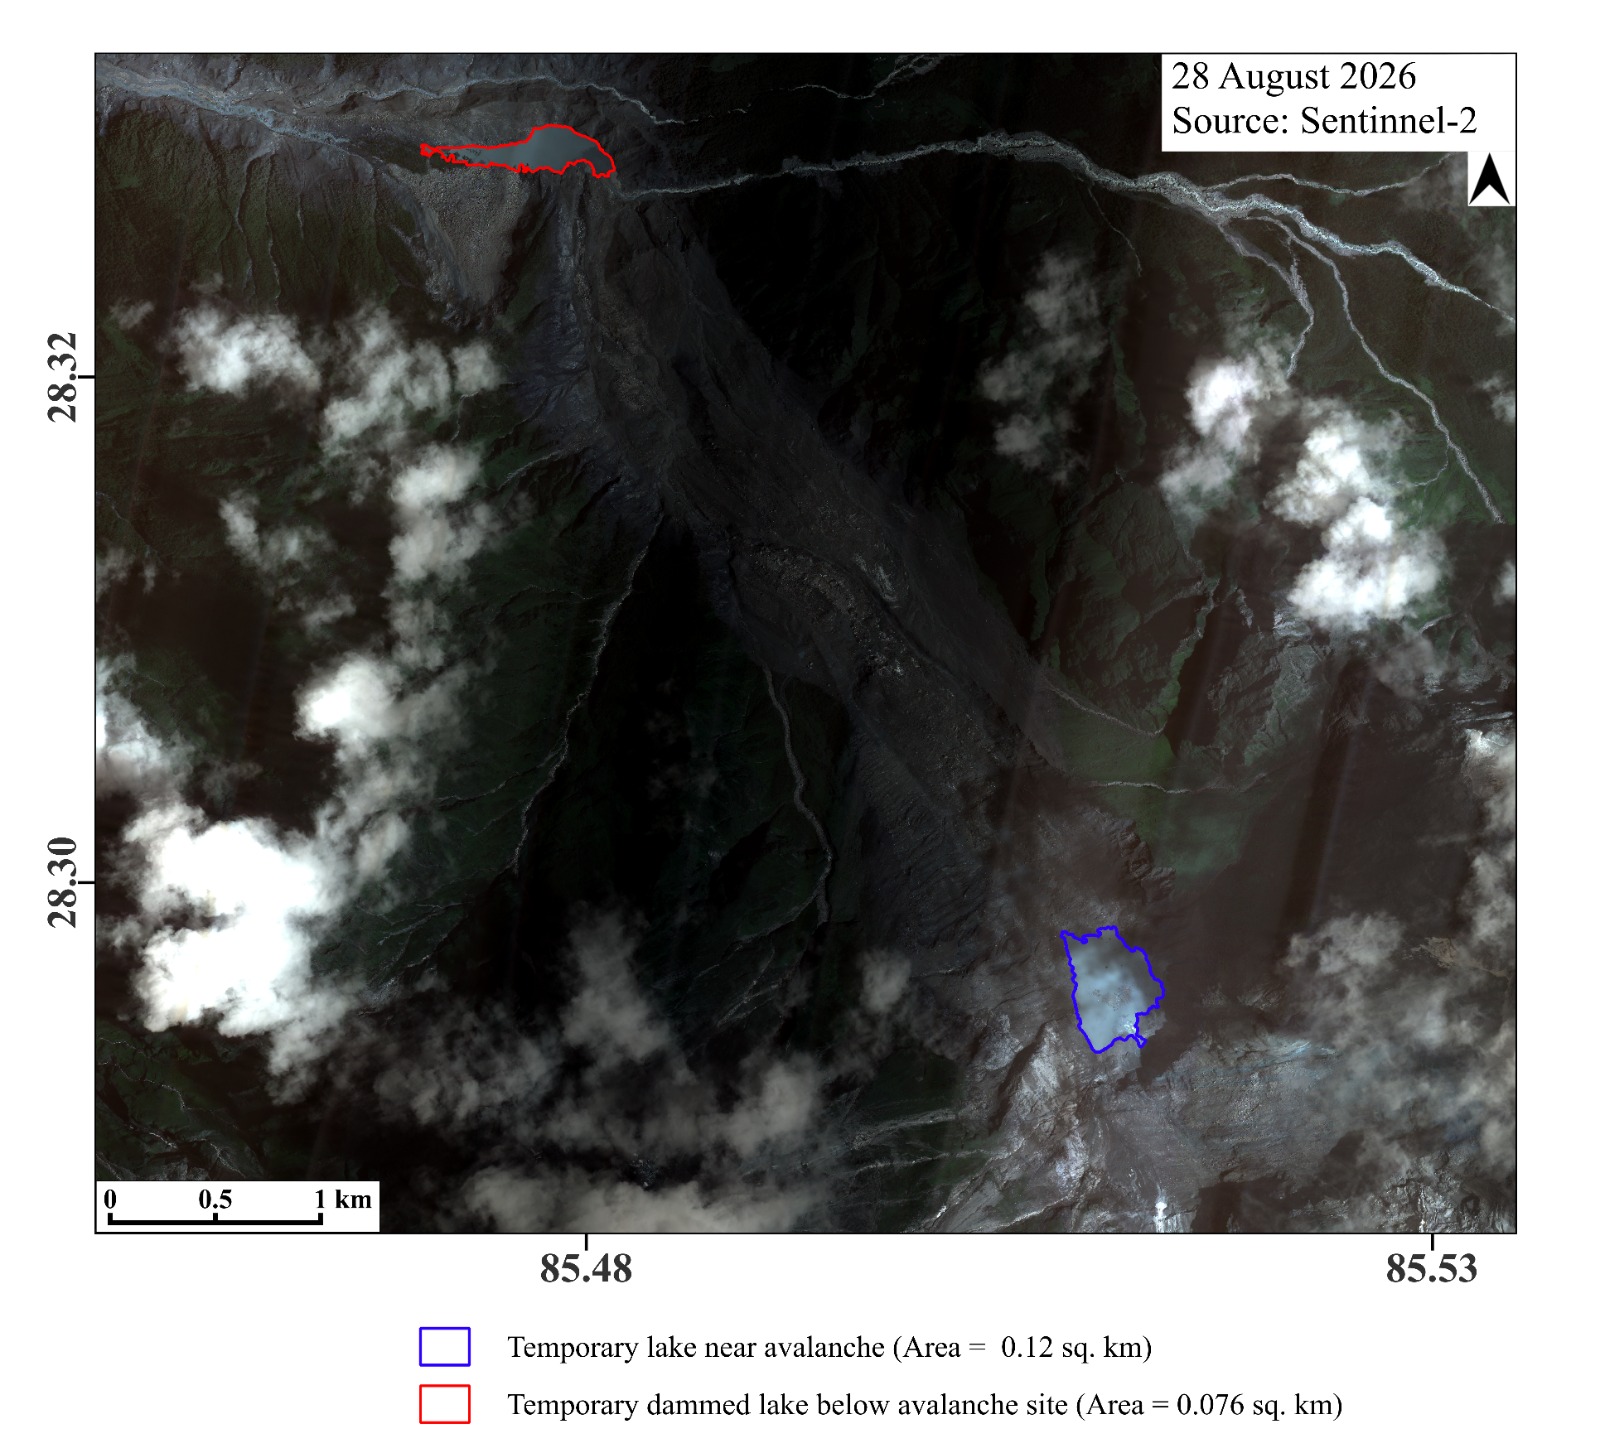
Two days later, on 28 August, satellite imagery revealed two water bodies in locations where no such features were visible before the event. The nearer one, about 1.6 km from the collapse point (28°17′33.85″N, 85°30′36.23″E), displayed a bright turquoise colour consistent with glacial meltwater carrying fine rock sediment. The second, larger pool, about 6.8 km away (28°20′0.18″N, 85°28′55.15″E), occupied the main river channel and was consistent with ponding behind debris obstructing the flow. Across much of the valley, vegetation had also visibly darkened, apparently coated by fine sediment deposited by the flood.
A Landscape Built on Ice
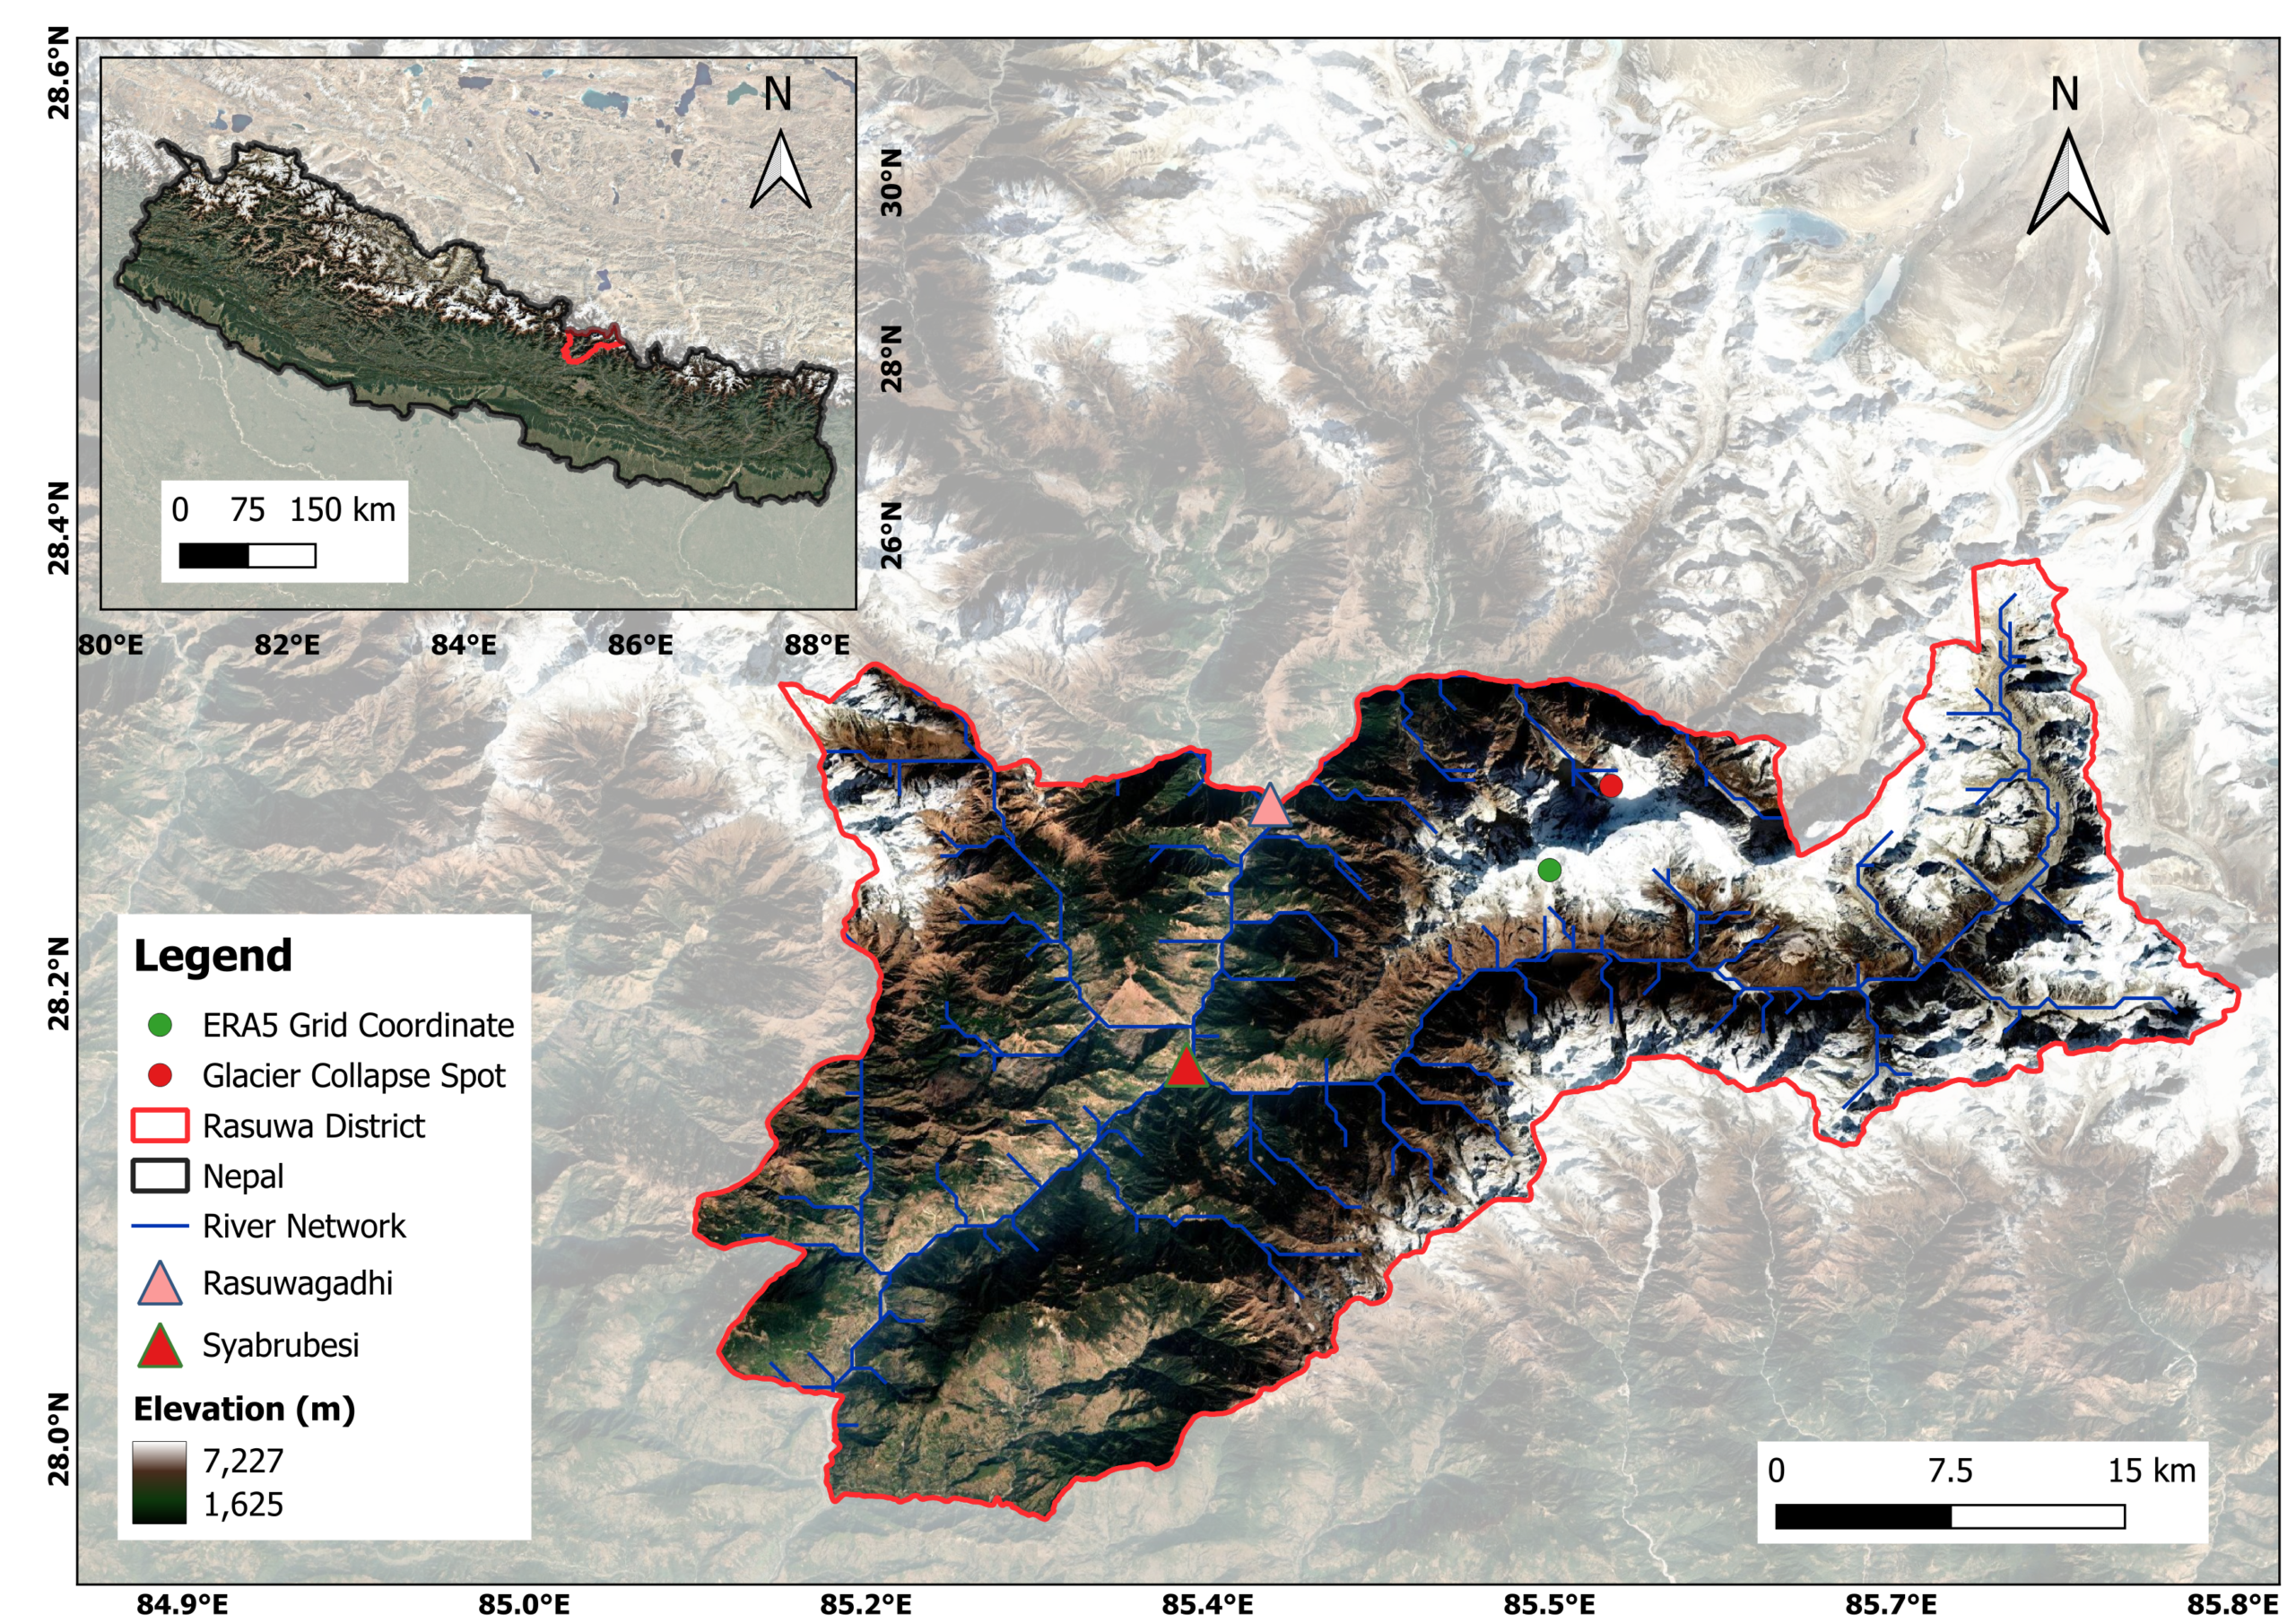
Rasuwa District, located 120 km North of Kathmandu, is one of Nepal’s mountainous districts, covering approximately 1544 km2 (Joshi & Joshi, 2016) and extending from 27.97° N – 28.38° N and 85.67° E – 85.78° E (Devkota, 2022). The district has a varied elevation range, from approximately 1625 m along the river valley to 7227 m at the summit of the Langtang Lirung, representing the minimum and maximum elevation, respectively. The wide variation in elevation and rugged terrain gives Rasuwa a diverse climate, with a relatively warmer, temperate climate in the southern lower areas and a much colder, tundra climate at the northern high elevations (Devkota, 2022).
Rasuwa’s climate runs on a monsoon rhythm with easterly winds dominating from June to September and westerly winds from October to May, modulated locally by valley winds, and 70-90% of annual rainfall falls during the monsoon months. Precipitation also varies markedly across the steep elevation gradient of the Langtang Valley, ranging from around 2,000 mm yr⁻¹ at approximately 2,300 m to less than 1,000 mm yr⁻¹ near 3,900 m (Steiner et al., 2021; Immerzeel et al., 2014)
The northern part of Rasuwa includes the high-elevation and glacierized Langtang region, where the glacier collapse occurred. The collapse site is located at 28.287°N, 85.527°E, triggering the cascading ice-rock-debris flow and downstream flooding.
To track the thermal conditions around the collapse site, the ERA5 (Hersbach et al., 2020) reanalysis grid point at 28.25°N, 85.50°E was selected as the closest available grid point. The grid point is located just southwest of the collapse site.
The Long-Term Warning Sign
Strip away the seismic signal and the debris flow, and a much slower story emerges; one written not in minutes, but in decades of temperature records.
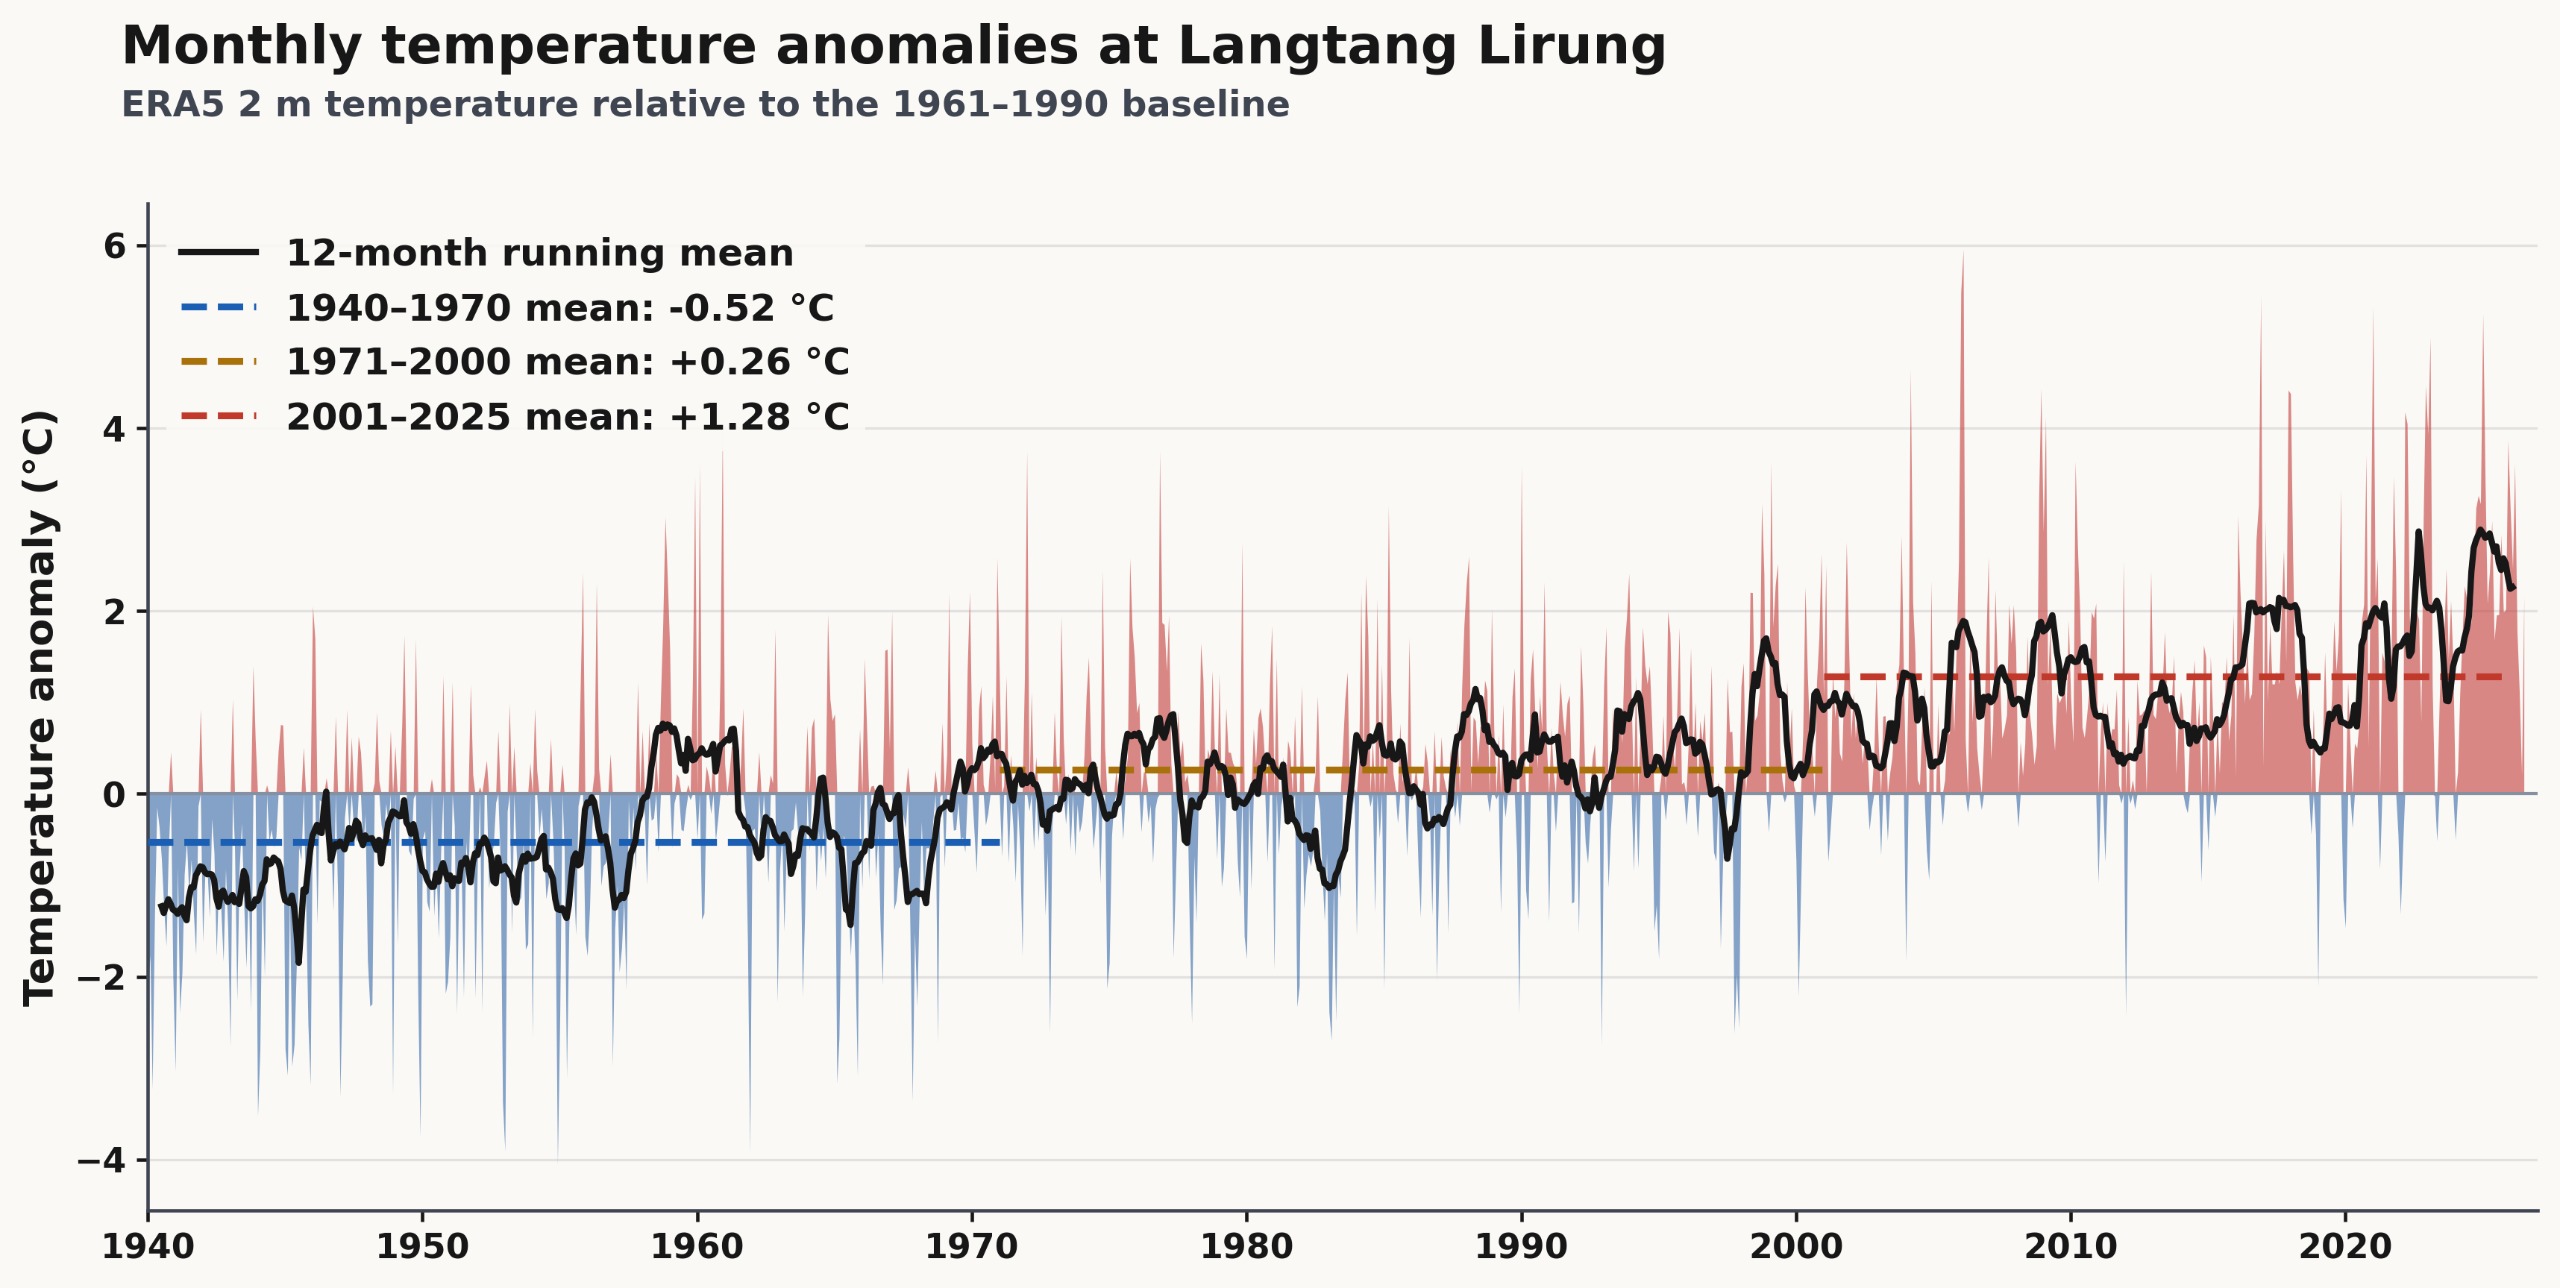
The monthly ERA5 anomaly record for Langtang-Lirung shows a landscape that has shifted, structurally, into a warmer regime. Positive anomalies now account for 58.2% of all months on record. Mean temperatures rose from −0.52°C during 1940–1970, to +0.26°C during 1971–2000, to +1.28°C during 2001–2025, and the 12-month running mean confirms this isn’t a run of hot summers, but a continuous, multi-decade rise in baseline conditions.
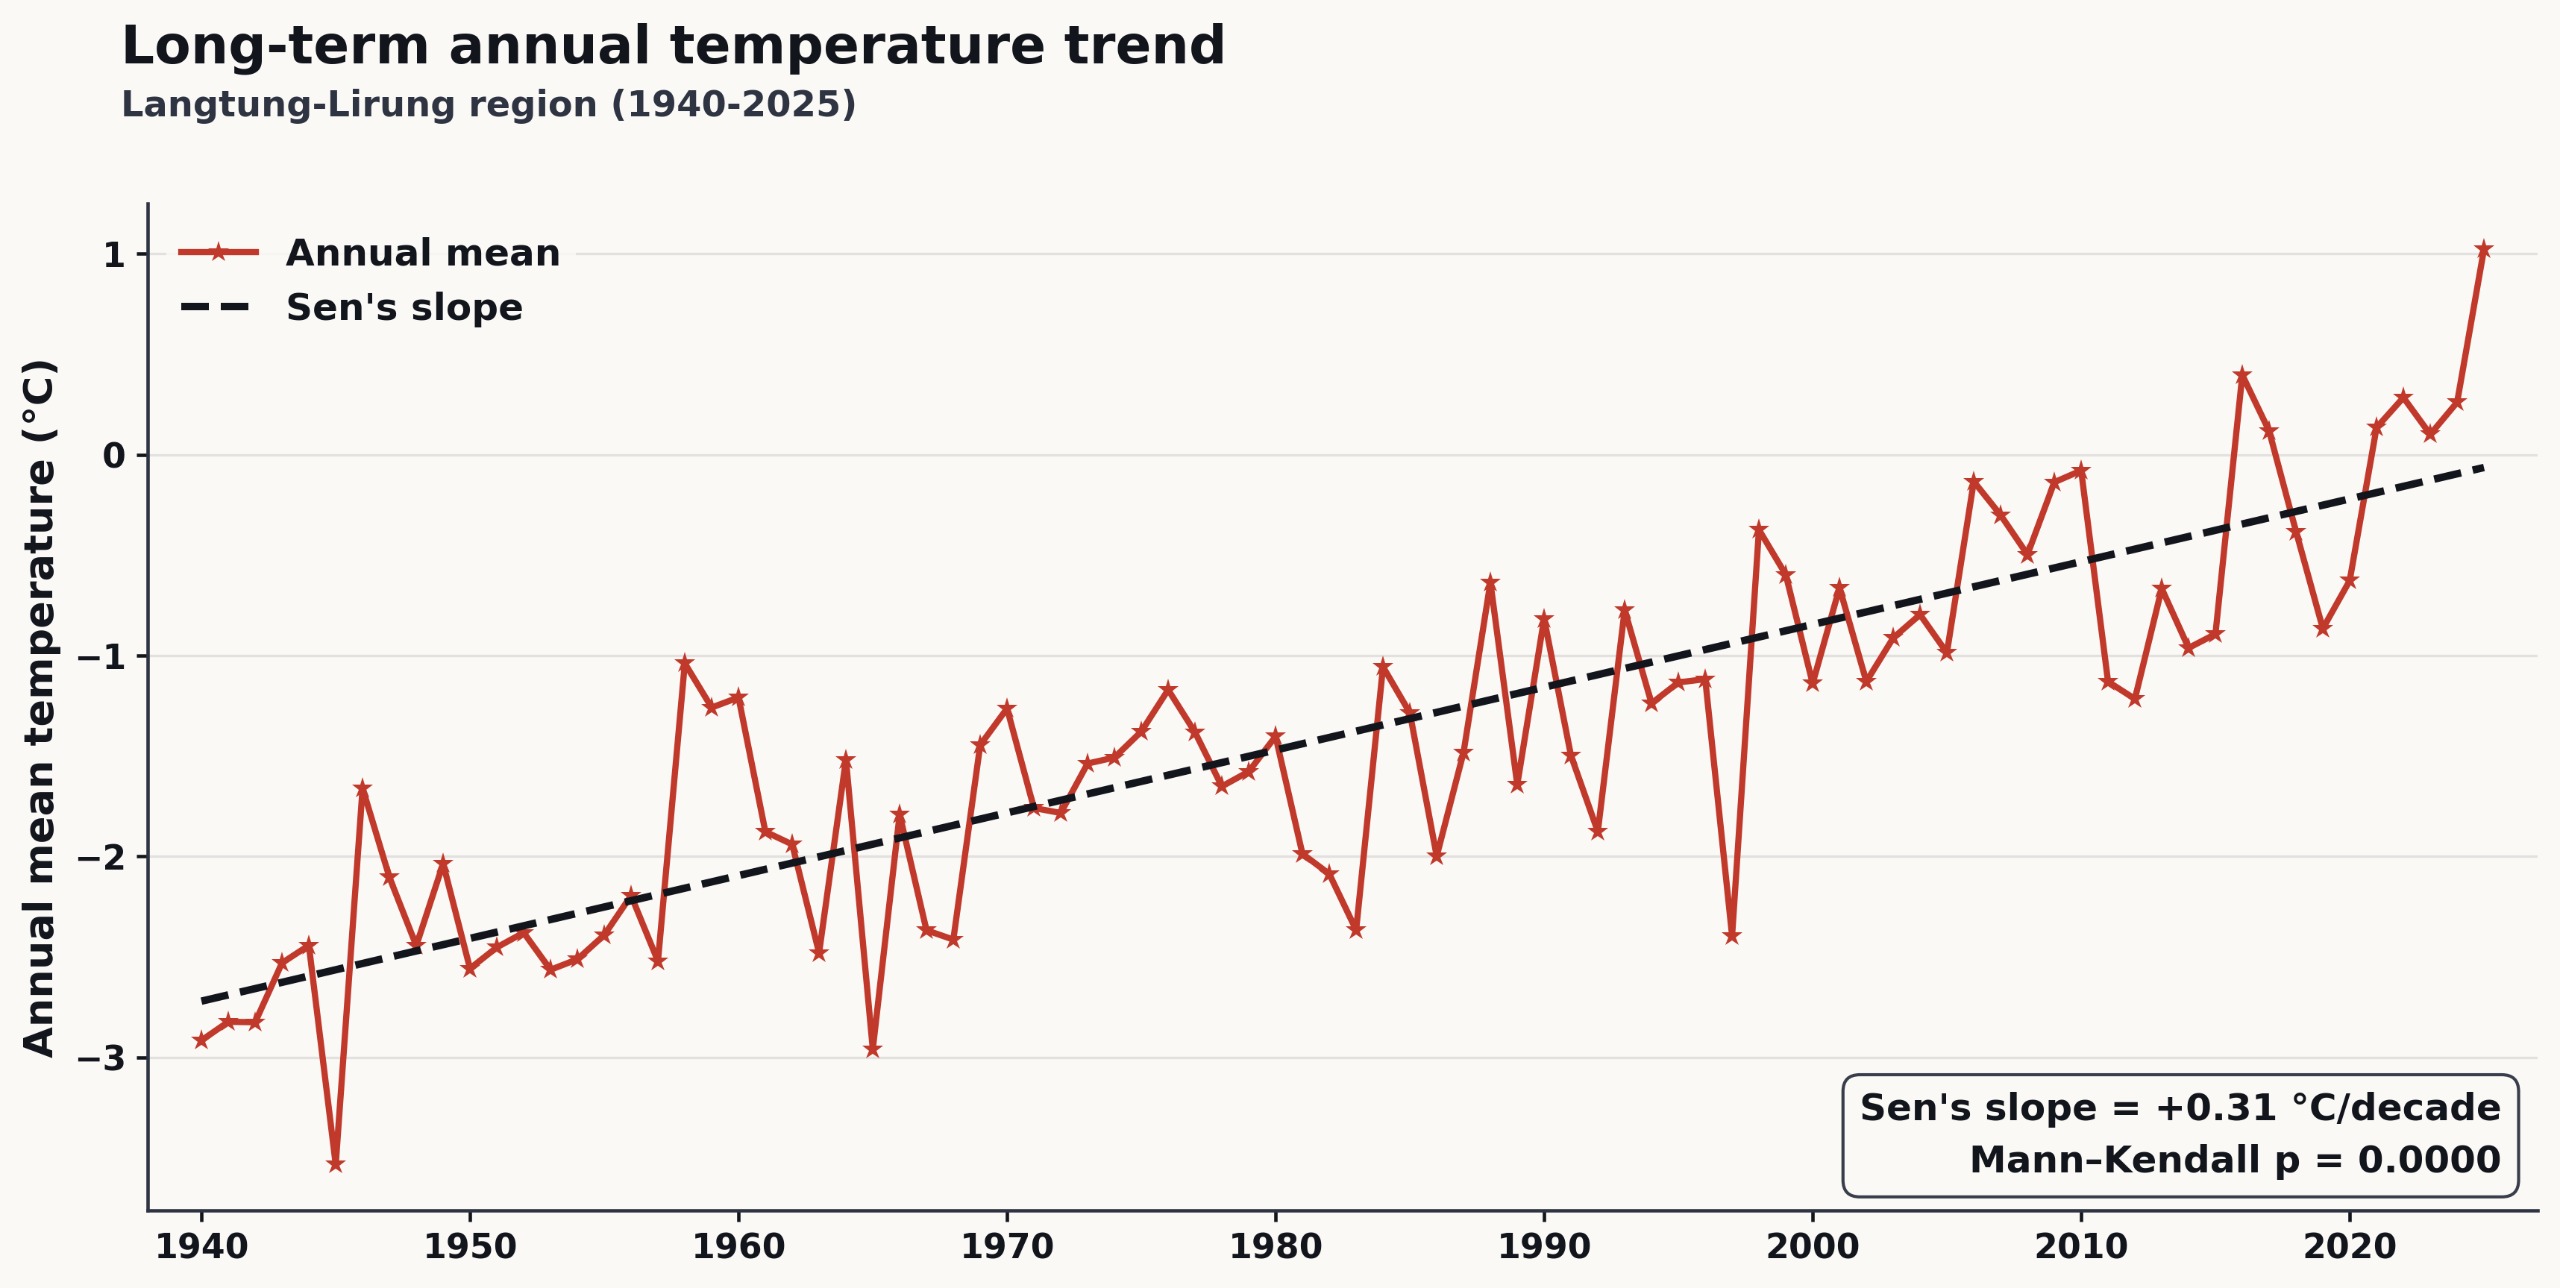
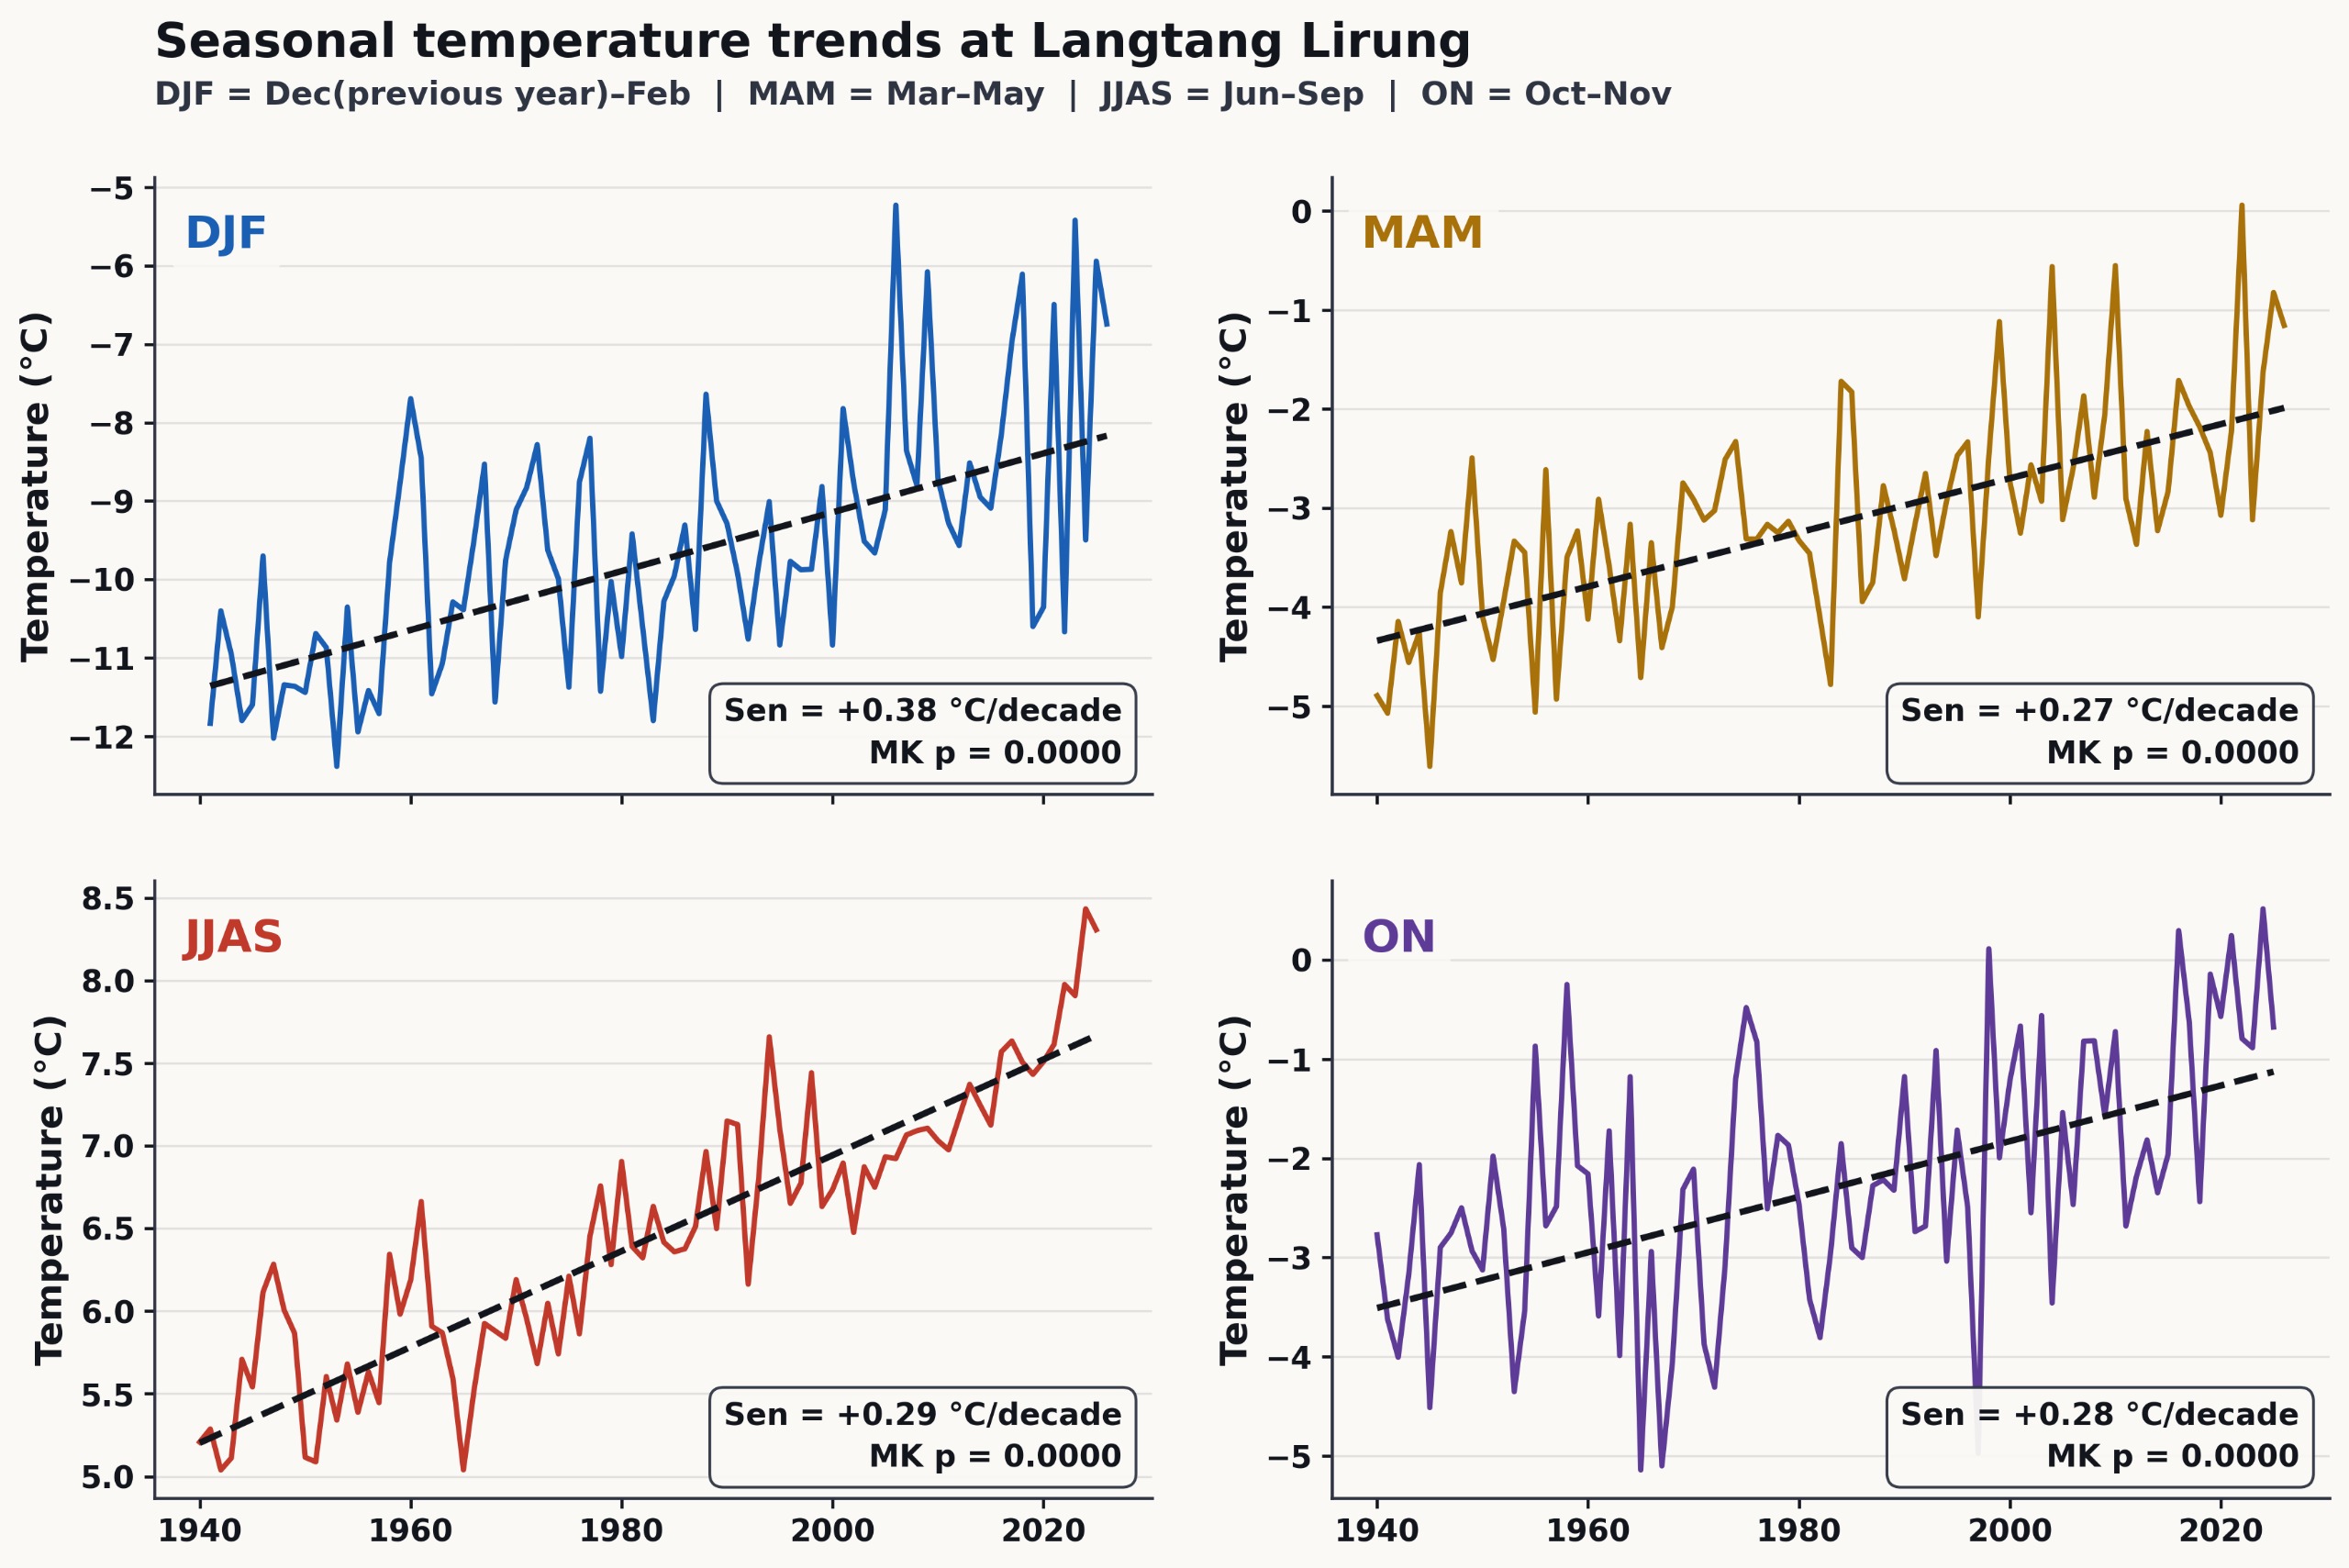
On an annual basis, the trend is unambiguous: a Mann-Kendall test finds a highly significant monotonic warming trend (p < 0.001), with a Sen’s slope of +0.31°C per decade. Comparing the earliest decade on record (1940–1949) with the most recent (2016–2025), the mean annual temperature has risen by 2.58°C, from −2.53°C to +0.04°C. The year 2025 stands alone as the warmest on record, at +1.02°C above the historical baseline.
A Slope Losing Its Grip
Warming of this magnitude does more than shift an average; it degrades the physical structure of a mountain from the inside. Winter has warmed fastest of all, at +0.38°C per decade (p < 0.001), a rate steep enough to erode the deep permafrost that binds rock fractures at elevation. At the same time, elevated temperatures increase liquid water production inside the glacier body, generating internal hydrostatic pressure and reducing friction along the ice-bedrock interfaces that hold a mountain face together.
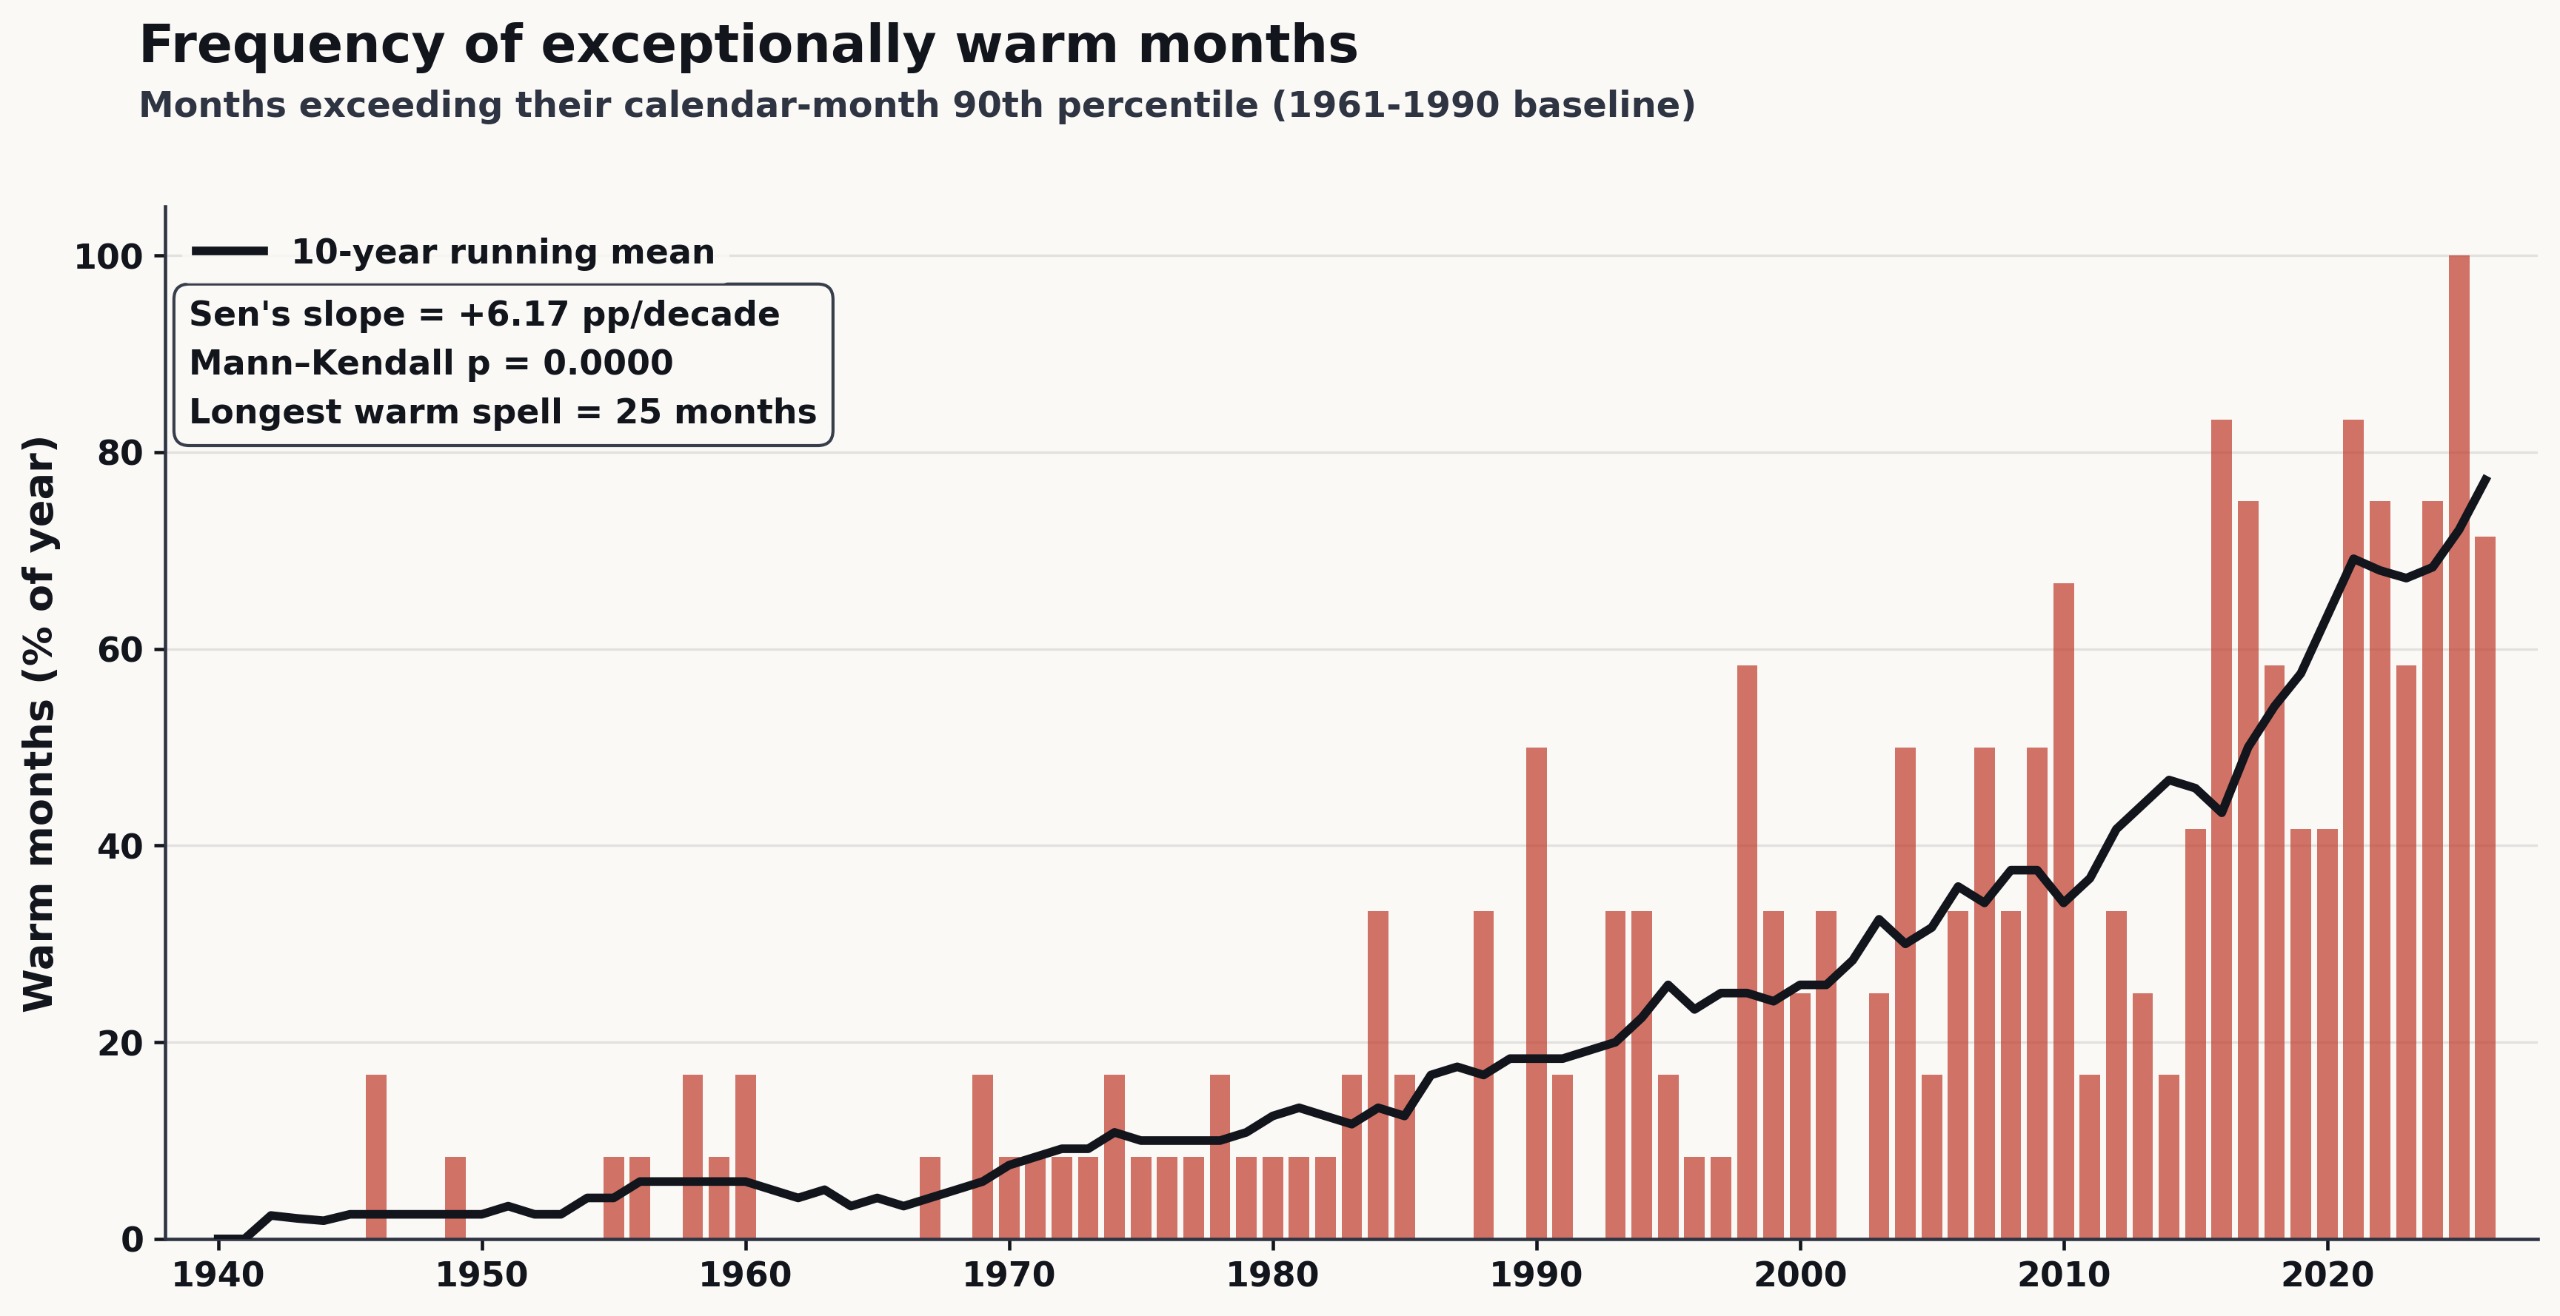
The record also shows an accumulation of thermal stress with no historical precedent at this site. Months exceeding the calendar-month 90th percentile of the 1961–1990 baseline, ‘exceptionally warm’ months, which by definition should make up only 10% of the record, instead accounted for 40.5% of all months between 1991 and 2025. In 2025, every single month qualified as exceptionally warm, part of a continuous 25-month warm spell running from April 2024 to April 2026, right up to the collapse.
It’s against this backdrop that the mechanics of 26 August played out. As millions of tons of ice and rock fell more than 1,200 metres, kinetic energy and intense inter-particle friction pulverized the ice into fine particles. That fragmentation sharply increased the ice’s surface area, promoting rapid melting and transforming what began as a dry mass movement into a water-rich flood surge within roughly 30 minutes. Furthermore, because this debris mass traveled far faster than normal streamflow, it acted like a high-speed wedge, sweeping up pre-existing river water along its path. This process transferred kinetic momentum to the standing channel flow and incorporated its volume, rapidly bulking the surge into a higher-energy flood wave.
Beyond the Next Disaster
Events like Langtang-Lirung ask us to look past the traditional hazard framework – one built around single, discrete triggers- toward something more continuous. The warming trend in the ERA5 record argues for a shift from reactive disaster response toward integrated, physics-informed monitoring: high-frequency satellite observation, automated field sensors, and dynamic hydrodynamic modelling working together to protect the communities living downstream.
That said, ERA5’s relatively coarse spatial resolution and the absence of long-term, site-specific observations at the collapse site itself limit how precisely this record can speak to local conditions. The warming trend documented here is best read as an important regional climatic context, the conditions the mountain was operating under, rather than direct evidence of what happened at the exact point of failure.
References
- Center for Land Surface Hazards (CLaSH). (2026). August 2026 Nepal Trishuli Flood. ArcGIS StoryMaps. https://storymaps.arcgis.com/stories/f2b2425eac544929a7d18f4c90b41d66
- Devkota, R. (2022). Regional Sustainability. https://www.researchgate.net/profile/Binod-Dawadi/publication/362170204_Impact_of_climate_change_on_agricultural_production_A_case_of_Rasuwa_District_
Nepal/links/62da413bf3acdd5dc20cfa95/Impact-of-climate-change-on-agricultural-production-A-case-of-Rasuwa-District-Nepal.pdf - Hersbach, H., Bell, B., Berrisford, P., Hirahara, S., Horányi, A., Muñoz-Sabater, J., Nicolas, J., Peubey, C., Radu, R., Schepers, D., Simmons, A., Soci, C., Abdalla, S., Abellan, X., Balsamo, G., Bechtold, P., Biavati, G., Bidlot, J., Bonavita, M., … Thépaut, J.-N. (2020). The ERA5 global reanalysis. Quarterly Journal of the Royal Meteorological Society, 146(730), 1999–2049. https://doi.org/10.1002/qj.3803
- Immerzeel, W. W., Petersen, L., Ragettli, S., & Pellicciotti, F. (2014). The importance of observed gradients of air temperature and precipitation for modeling runoff from a glacierized watershed in the Nepalese Himalayas. Water Resources Research, 50(3), 2212–2226. https://doi.org/10.1002/2013WR014506
- NDRRMA. (2026). Rasuwa-Bhotekoshi Flood: Search, Rescue and Relief Response.
Steiner, J. F., Gurung, T. R., Joshi, S. P., Koch, I., Saloranta, T., Shea, J., Shrestha, A. B., Stigter, E., & Immerzeel, W. W. (2021). Multi-year observations of the high mountain water cycle in the Langtang catchment, Central Himalaya. Hydrological Processes, 35(5), e14189. https://doi.org/10.1002/hyp.14189